

Tidemark, an analytics company for large enterprise companies ($500 million annual profits +), has introduced a new infographic-style software called Storylines, which display’s a company’s profitability and focuses on actionable data. The new tool is a set of pre-designed visualizations that pull data directly from a company’s backend, creating a dynamic graphic that illustrates real-time metrics.
“Business reporting is broken, stagnated decades ago, built upon stacks of dense, complex, and dated reports and dashboards that few people ever read,“ said TideMark Founder and CEO, Christian Gheorghe. “Data is nothing without context.”
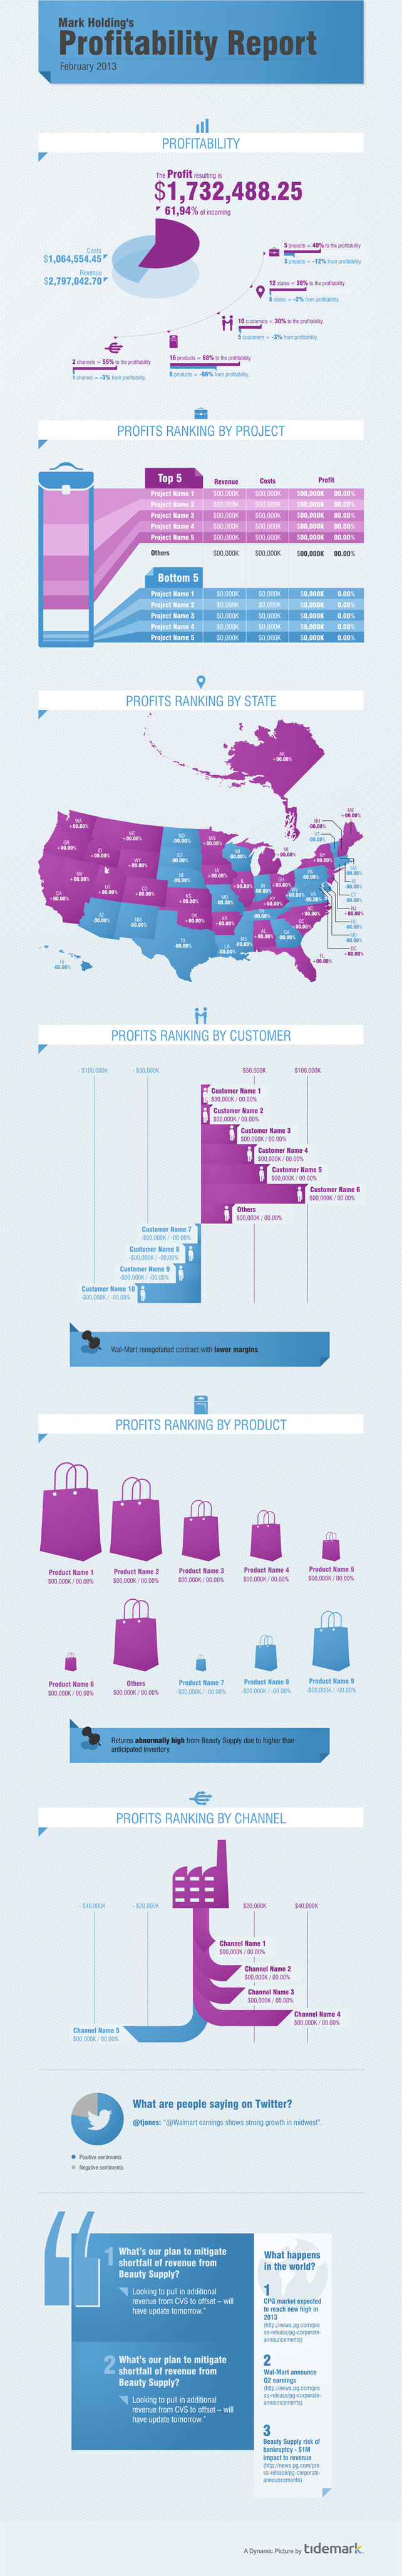
Storylines make it possible to change certain insights, experiment with possible outcomes, and forecast different schedules right in the visualization. For example, in a Profits storyline, you can drill into a profit map at the international, national, or state level, or parse the profits at a different date, or quarter, simply by changing the inputs on the screen. It gives employees the power to manipulate the data directly, at the touch of the screen.
Check out their example below:


Recent Comments